
Following an overwhelming response from national businesses and sympathetic nations across the globe, Britain now has a huge surplus of PPE (personal protection equipment) and testing kits. This is a complete turnaround from the situation only a week ago. Embarrassed politicians are now having to explain why and find a fair way to redistribute them to parts of the world where they are still desperately needed. Gowns and masks are already being sold illegally on the “blue market”, as the new practice is called, with organised crime netting millions in the process. Health officials are also worried that NHS trusts and care homes are being duped by websites offering fake testing kits at a quarter the normal price. Some of these have been found to be just repackaged pregnancy testing kits. The government issued a statement today stating that “the cost to the economy of using these kits would dwarf the amount saved and cause untold misery to a significant proportion of the population. There is no shortage of the genuine kits and any authorities found using them [the fake kits] will incur severe penalties”.
Now that NHS and other care staff are properly protected and able to get on with their jobs with little or no fear of infection, a huge avalanche of patient data and other documentation is poised to engulf the depleted army of statisticians and pundits remaining after COVID-19 has run its course. China has sent a crack team of statisticians from Wuhan, the original source of the virus, to help with data collection and analysis. President Trump has taken a dim view of this, tweeting that “Letting these people loose on this is the same security threat as having Huawei provide 5G networking. Don’t do it.” Boris Johnson has yet to comment.
According to the chief scientific adviser “Big data on the pandemic are likely to rot in the fields unless means can be found for storing and analysing the sheer volume of data this outbreak has created while it is still fresh”. Experts at the Large Hadron Collider (LHC) at CERN near Geneva have offered use of their facilities while the physics programme remains on hold. The LHC produces and processes approximately 15 petabytes of data per year; that is the equivalent of one photograph (2 MB) per year per person on the planet, roughly the same rate as the pandemic.
Without the ability to analyse the data and the policies and procedures developed to deal with the pandemic there is no chance of understanding how the virus behaves and how to combat it, what decisions were good or bad and who was to blame. So, in cooperation with Oxbridge University’s department of virology (nothing to do with virility) we are starting a new peer-to-peer computing project, similar to SETI@home (Search for Extra Terrestrial Intelligence) called COVID-19@home . This project will utilise the massive computing power distributed across the nation and connected by fast and superfast broadband internet to analyse data from healthcare sources and correlate it with historical data from tracing apps.
Some important facts about statistics
There are two kinds of people in the world: scientists and people like you and me. These two types of people see the world very differently. Here are two examples from the COVID-19 outbreak.
The graph. This is what a graph looks like to a scientist (remember we include statisticians here because they understand numbers, whereas politicians do not).
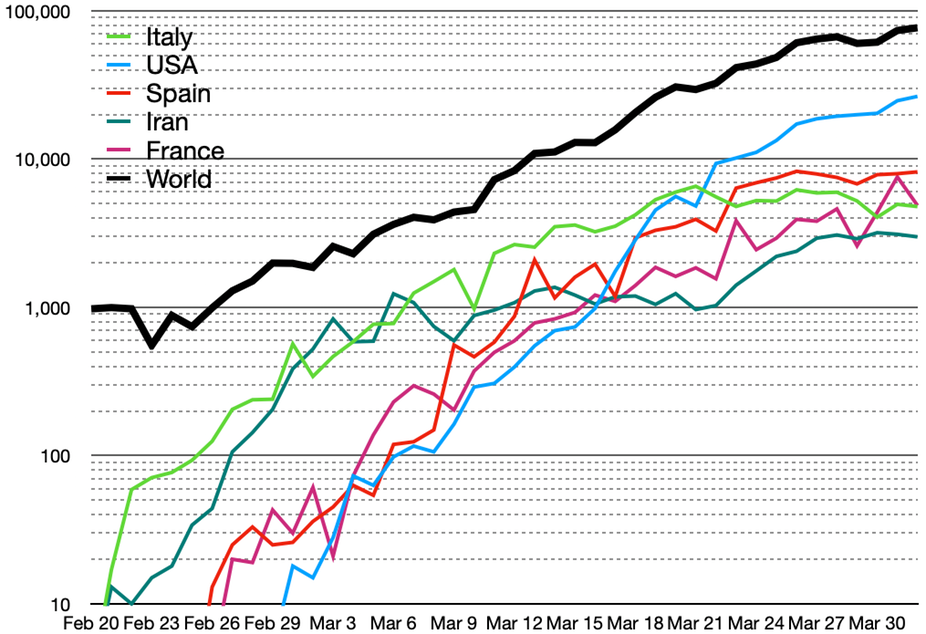
And this is what it looks like to you and me (remember, we include politicians here because they are no different from you and me, even though they still refer to us as “the people” and themselves as “the government” or “the opposition”). What we see is some nice colours and shapes.

Charts & diagrams. Here is what a bar chart looks like to a scientist:
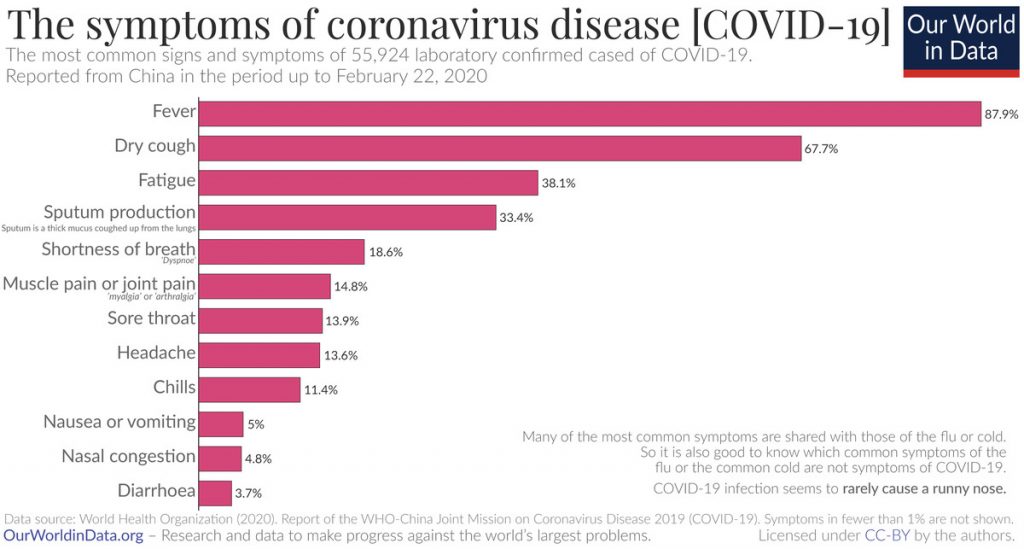
And this is what a complicated diagram looks like to us with lots of information in it: