
What IS Greening the Spark?
Greening the Spark is about green electricity. And not so green electricity. It’s about how we generate, store and distribute electricity around the country and how we can control how much it costs and what impact it has on the environment.
Greening the Spark is a model of a system for electricity generation, distribution, storage and consumption – in short, a typical national grid. Originally started as a proof of concept and general purpose simulator, it is now being developed as a demonstrator for a hands-on museum exhibit. To clarify the scope of the project, here is a list of questions it is intended to answer and ones that it is not designed to answer:
Too fundamental:
- What is electricity?
- What is electricity used for?
What this project addresses:
- Where does our electricity come from?
- How does electricity get to where it’s needed?
- How are electricity supply and demand matched?
- How much of world energy consumption is electric?
- How much electric power comes from each kind of source?
- What is green electricity and how green is it?
- What are the relative costs of each type, both financially and in terms of environmental impact?
- What types of electrical energy storage are there, how much is needed and what are their costs?
Too far ahead:
- How safe are the different types of electricity production?
- How green will our electricity be by 2030 and 2050?
- Will we have the resources to build and fuel enough electricity production and storage for future consumption?
- When will nuclear fusion be a viable source of electrical energy?
Greening the Spark has been developed over the last year and a half and contains physical representations and software models of the elements of a national grid. It can operated as a hands-on exhibit and played as a game via two hardware control panels.
If you want to get straight into the nitty-gritty go to the Tech-Talk page.
Introduction
Throughout human history energy has been the engine of our economies, driving social, political and technological change. As we have relentlessly expanded and taken over the planet demanding ever higher living standards, our appetite for energy has known no bounds. Until now that is. In our efforts to satisfy this appetite we have picked all the low hanging fruit and now face major resource challenges: the scarcity of materials needed for our technologies and the increasing costs of extracting and purifying them, the costs of creating, maintaining and disposing of energy related infrastructure and, most of all, the growing costs associated with extracting and processing the fuels needed to provide this energy. These costs are by no means purely financial: they also include damage to other species and their habitats, increased pollution and significant contributions to climate change. Even the 15% of the world that are still “off-grid” contribute to these costs because, although their standard of living is low, their means of subsistence are very inefficient.
While the earth continues to spin on its axis, so spin the politicians and multi-nationals on theirs. The world is in crisis and yet we have the means to avert a looming planetary catastrophe by managing our energy better. Electricity generation takes up ~10% of total energy production globally and so is only a small part of the picture. However it serves as a model for how the energy crisis can be tackled and is the focus of this project. By shining a light on the business of producing and consuming electricity it is hoped that many of the issues associated with the wider energy economy will be examined and help us understand what “managing our energy better” actually means.
The following is a summary of what Greening the Spark is and what it does. For a general overview, download my Powerpoint presentation here.
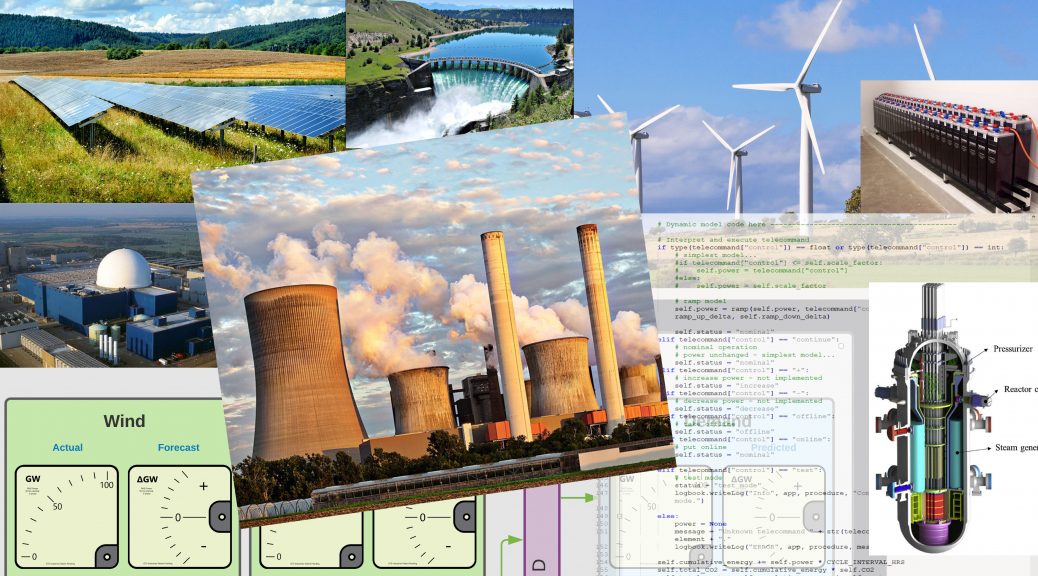
Infrastructure
Emulating a typical national electricity grid, Greening the Spark provides models of wind and solar farms, fossil fuel and nuclear power stations, battery and pumped hydroelectric storage, consumer demand and a grid monitoring and control system to manage it all. Each of these elements can be scaled individually, so configurations past, present and future can be modelled with different proportions of renewables and non-renewables, different mixes of fossil fuels such as gas and coal and conventional nuclear and small modular reactors. The configuration is easily extended to include other elements such as biofuels, tidal, hydrogen, geothermal, etc.
Software Models
Scenarios are presented as predefined timelines of weather (wind & sun) and consumer demand, with forecasts for each. Fossil fuels and nuclear power generation can be controlled manually by an operator or autonomously. Storage elements are controlled by an autonomous storage management system.
Physical Models
The wind and solar farms are represented as a group of model wind turbines and a sun lamp with an image of solar panels.
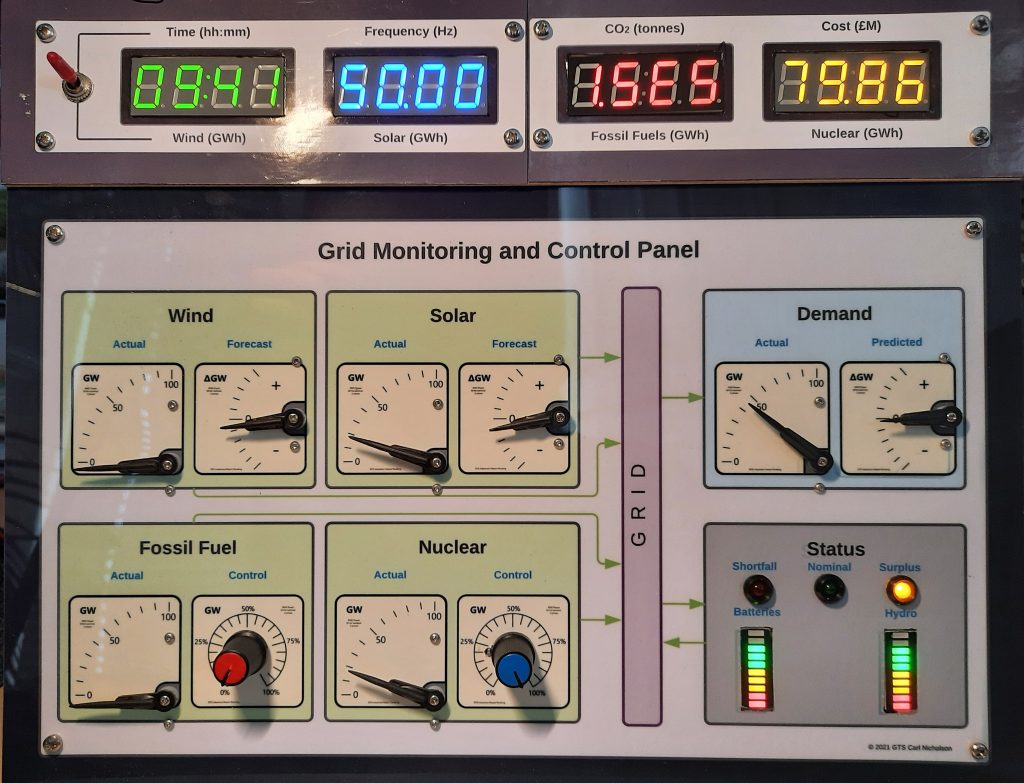
The operator interface to the grid monitoring and control system is a >>real<< physical control panel with various displays and control inputs as shown in the picture below.
Modes of Operation
There are two modes of operation for the visitor:
Exhibit mode. This runs in real time and is a model of a national grid control centre with hands-on or autonomous control of fossil fuels and nuclear power generation. Manual control is initiated by touching one of the controls; autonomous control is resumed after a period of inactivity.
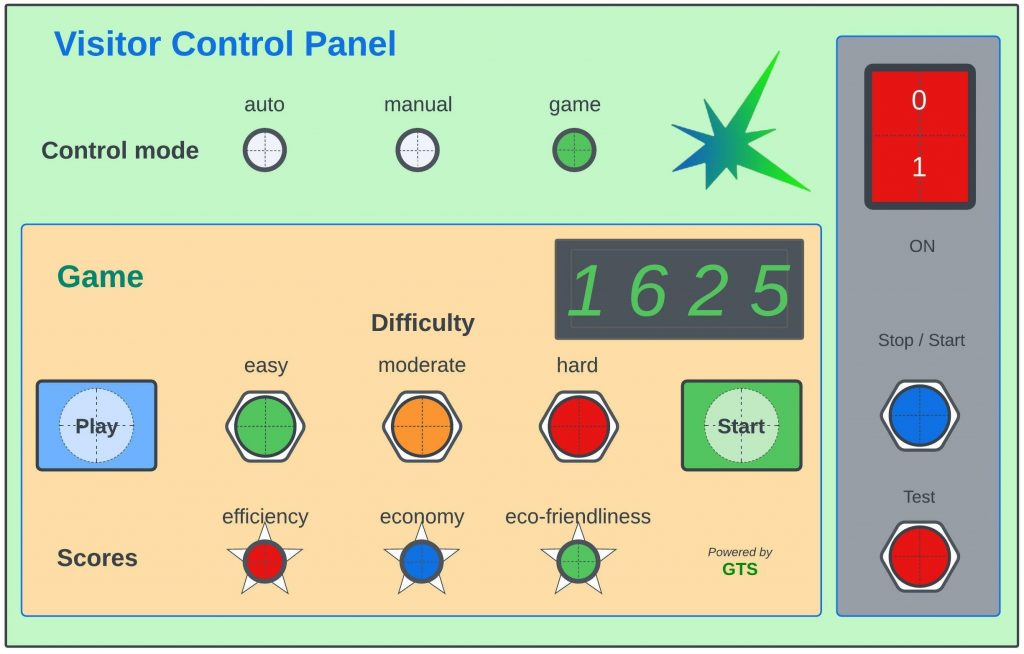
Game mode. This involves controlling the grid over a 10 minute period played out at 144 times real time, so covering a whole day. The objective is to adjust fossil fuels and nuclear power generated to avoid any blackouts or surplus power, to minimise either cost or carbon footprint and to keep the storage levels at ~50%. There are three levels of difficulty (easy, moderate and hard) and the results are presented in the form of three “e-sparks”, which can be red, blue or green, depending on overall performance.
There is also test mode for use by staff. Operation is controlled via the visitor and staff control panels (shown together here).
What (ever) next?
This is a proof of concept prototype which demonstrates the basic functionality of a national grid and points the way forward for development as a hands-on museum exhibit, a teaching aid, or a working model for science fairs and exhibitions.
There are many ways in which it can be developed, such as extending the range and sophistication of the physical and software models, theming and artwork, enabling remote access, live streaming of National Grid data, networking with other installations, advanced GUI design, AI control, data analysis and presentation – the list is endless.
Further information
I will be happy to give short a presentation and demonstration at my home in Brighton, UK. This takes about an hour, depending on the number of questions.
For more technical details on GTS, please visit my Tech-Talk page which is work in progress and includes detailed descriptions of operation, algorithms, code and – of course – more pictures.
For further information on projects I have worked on, in particular in Space Operations and Crystal Mazes, see my CV on the INFO page.
And now the inevitable QR code, just to make it all nice and easy:

Acknowledgements
This project would not have come to anything if it hadn’t been for the initial inspiration by Natasha Thoday who made me realise I could combine all my interests with doing something for climate change and aiming it at the museum / education sector, and much discussion with David Owers, my old Cyberdrome partner in crime, now working part-time for the Brighton Energy Cooperative.
Feedback, encouragement and patience have all been supplied in abundance by friends and relatives too numerous to mention.
However, a special mention is due here to Ben Winter-Leinweber who, despite reading my endless emails about every little issue, still wanted to be involved with the project and is the architect and programmer of the online results database and API. Ben is a website developer from Brighton. His solution for the GTS “scoreboard” includes a MYSQL + Django Rest Framework API backend, and a React.js frontend. This design was chosen as it facilitates a simple data pipeline solution and user experience. His website will soon be available at benwl.com.